
I host many of my applications on my own server to keep control of my data. This makes it possible to run various evaluations of this data. Today I would like to show how this can be visualized with Metabase.
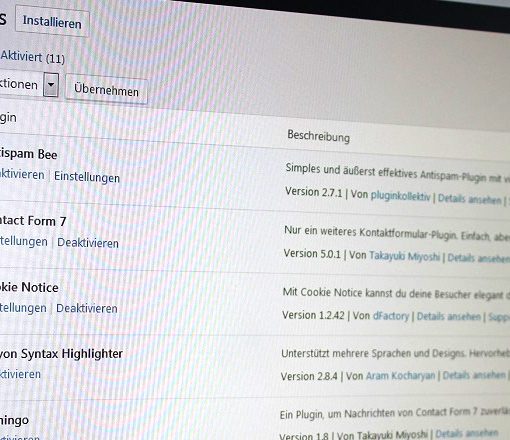
Which applications I have installed and use on my server, I have already listed in a previous post. These applications all store their data in a database, which I also host independently. This gives me access to all data.
In order to be able to run different evaluations about it, I found Metabase. This allows you to create reports in which you can ask so-called “questions” and provide a visual representation of the desired information. However, this tool can only be used if it is possible to connect to the respective data source.
Installation
Installing Metabase is very easy. The entire application is packed in a jar file. If Java – at least Java version 7 – is installed on the system, the following command is sufficient for execution:
java -jar metabase.jar
This starts the application on port 3000, but this port can be configured using the “MB_JETTY_PORT” environment variable. For example, if you use an Apache, you can access Metabase via “mod_proxy”.
Asking Questions
Logically, there are no reports for a fresh installation. So the first step is to ask a so-called question. Here you can choose whether you want to create a metric, which I haven’t tried yet, click a query together or create your own, possibly complicated SQL query.
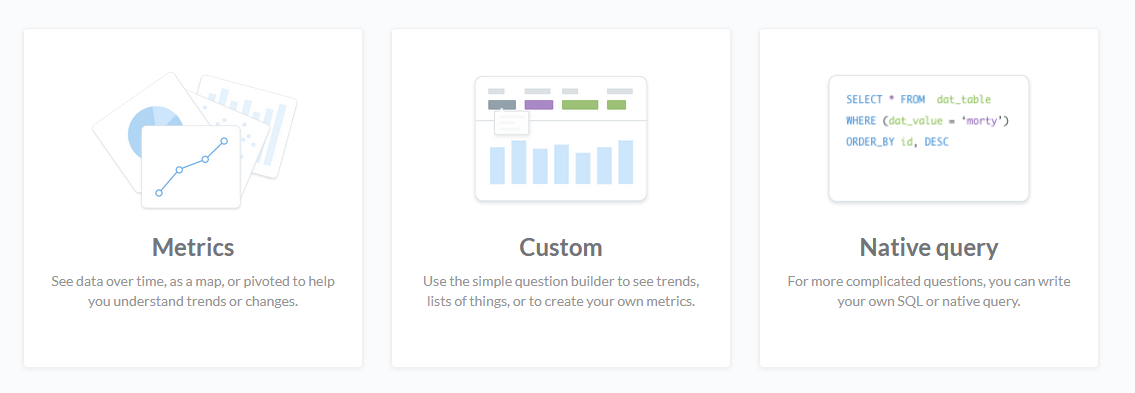
If you choose the middle menu item, you can create a report without knowledge of the query language or structure of the database. After selecting a table, you can choose the conditions and display form step by step.
If you are familiar with SQL and also know about the table structure, you can start more specific queries under “Native Query”. Here the automatic completion can be very helpful sometimes.
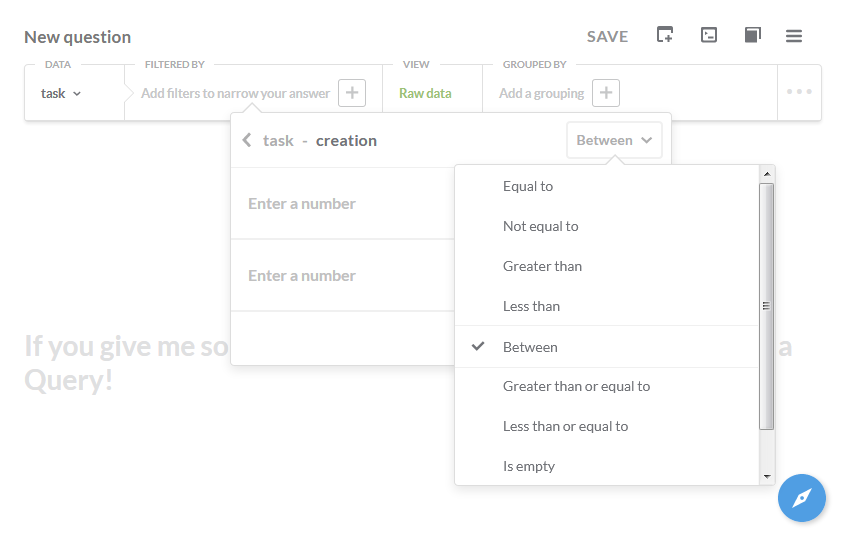
Once you have selected the data basis and filtered, sorted and grouped according to your requirements, the result is displayed as a table by default. Depending on the result, this view can also be automatically changed to a line, column or pie chart. There are a total of 11 different display options. Once you have decided on one of them, you can save the report, where you can then define a name and a description.
Creating a Dashboard
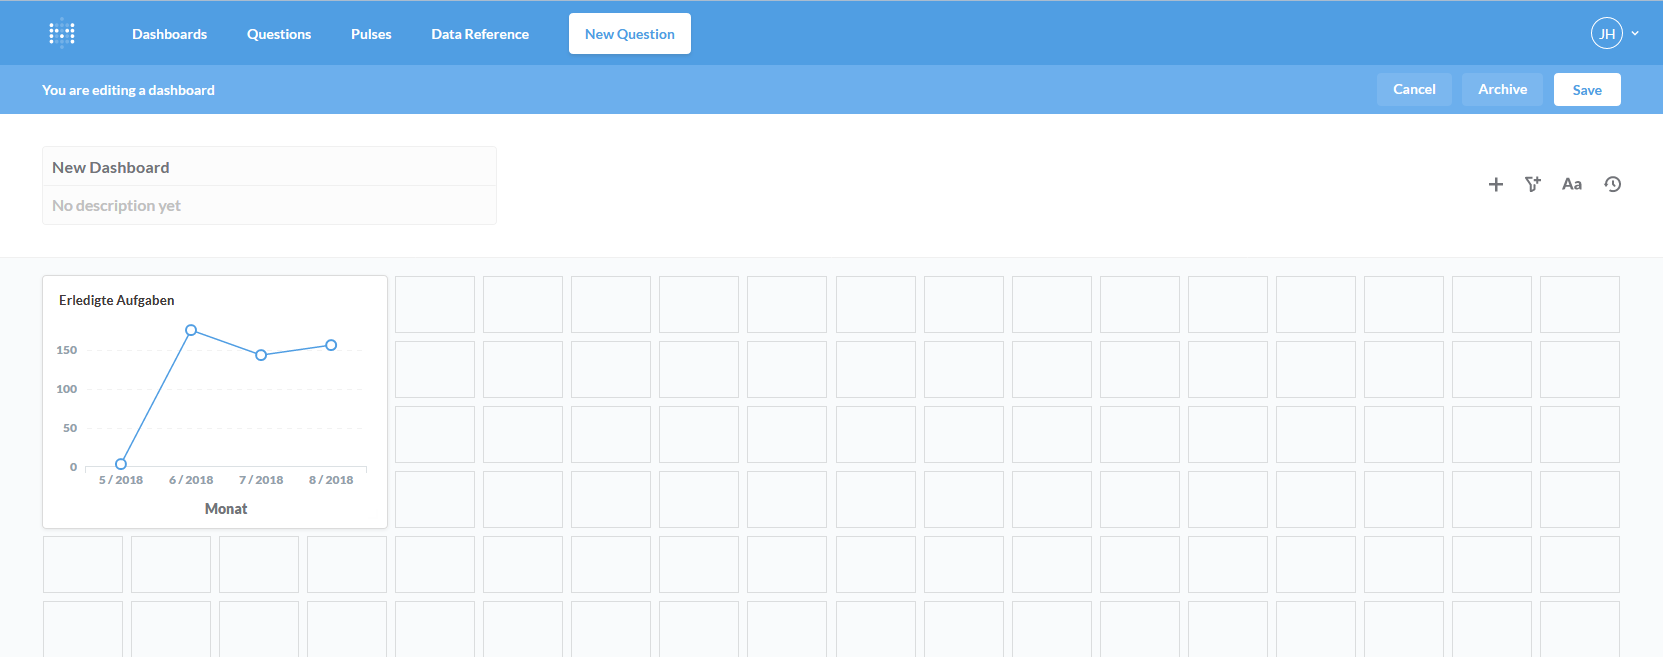
After you have created several questions with the same content, you may not want to view them individually but as a whole. Metabase provides dashboards for this purpose.
If you create a new dashboard, you get a blank page. Here you can insert the previously created questions into a grid view. Up to 18 columns are available in width. If desired, the diagrams or tables of the individual questions can be displayed wider or higher. The respective display form behaves responsively. This allows various reports to be displayed clearly at a glance.
Working as a Team
So far I use Metabase only for myself, but a work in a team is also supported. This is also the aim of the “pulses”, so that everyone is at the same level. With the help of the “Pulses”, selected reports can be sent to team members by e-mail at set times, for example.
In addition, there is the “Data Reference” item, where you can display the table structure of the linked databases. In addition, you can create an entry point for new team members here, since it is possible, for example, to move certain tables to the foreground and convey the structure above them.
Conclusion
Overall, I find Metabase to be a very chic, modern and above all easy to use tool with which you can create clear reports very quickly. Also the graphical representation of this is perfect and I am very convinced, especially because it is available for free.


